
How to Measure Customer Satisfaction: Methods, Metrics and Best Practice [2026]
How do you measure customer satisfaction in practice? The methods, the three metrics, who to survey in the buying group, and where passive signals fit alongside the survey.
![How to Measure Customer Satisfaction: Methods, Metrics and Best Practice [2026]](/img/knowledge/measure-satisfaction.svg)
- You measure customer satisfaction by choosing a metric that fits your question: NPS for loyalty, CSAT for specific touchpoints, CES for friction.
- Separate relationship measurement (the whole account, quarterly) from transactional measurement (right after a specific experience). They answer different questions.
- A score is only as good as who you asked. Survey the buying group, not just your main contact, or a happy champion can mask an account that is actually at risk.
- Response rate determines whether your numbers can be trusted. Below 15-20% in B2B should make you question how representative they are. See how to raise it.
- The most expensive mistake is measuring without acting. A measurement that does not lead to a decision is wasted budget and wasted customer patience.
Contents11 sections
How do you measure customer satisfaction?
You measure customer satisfaction by choosing a metric that fits the question you actually want answered, sending a short survey to the right group of customers at the right time, and following up on the responses in a structured way. There is no single correct method, but there is a correct method for each purpose. If you want to understand loyalty, you measure differently than if you want to understand friction in a specific process.
In other words, good measurement does not start with a survey tool. It starts with a purpose. Once you know which decision the measurement is meant to support, almost everything else falls into place. This is the practical companion to our article on what customer satisfaction is.
Why measure customer satisfaction at all?
Because satisfaction is one of the strongest predictors of retention and growth, and because you cannot manage what you do not measure. A 5% improvement in retention increases profit by 25-95% (Bain & Company). Satisfaction is the mechanism that makes that retention possible.
But measurement only has value if it changes something. In fact, the most common reason measurement programs die is that they produce nice numbers nobody acts on. So the first question is never "which tool?" but "which decision is this supposed to help us make?".
Relationship vs. transactional measurement
The most important distinction in all satisfaction measurement is this: are you measuring the whole relationship, or a single experience?
Relationship measurement looks at the overall account. It is sent on a fixed cadence, typically quarterly, independent of any specific event. NPS is most often used here, because the question of recommendation captures overall loyalty.
Transactional measurement looks at a specific interaction: a support case, a delivery, an onboarding. It is sent right after the event, while the experience is fresh. CSAT and CES are typically used here.
| Dimension | Relationship | Transactional |
|---|---|---|
| Asks about | The whole relationship | One specific experience |
| Cadence | Quarterly / half-yearly | Right after the event |
| Typical metric | NPS | CSAT, CES |
| Used for | Strategy, early warning | Process improvement |
The two are not mutually exclusive. On the contrary, together they give the full picture: relationship measurement tells you that something is wrong, transactional measurement helps you find out where.
Choosing a metric: NPS, CSAT or CES?
The three common metrics measure three different things, and using them interchangeably leads to wrong decisions. Here is the short version, with a deeper comparison of NPS, CSAT and CES if you want more.
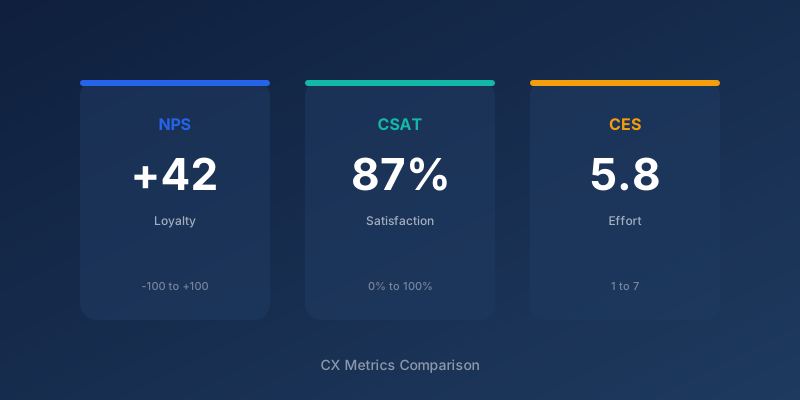
- NPS (Net Promoter Score): Measures loyalty and willingness to recommend on a 0-10 scale. Best for relationship measurement and predicting retention.
- CSAT (Customer Satisfaction Score): Measures satisfaction with a specific experience, usually on a 1-5 scale. Best for transactional measurement of individual touchpoints.
- CES (Customer Effort Score): Measures how much effort the customer had to spend to get their need met. Best for high-friction processes, and a strong indicator of churn risk.
Response rate: the foundation you cannot ignore
A measurement is only as good as the data behind it. If only your happiest or angriest customers respond, you are not measuring your customer base, you are measuring its extremes.
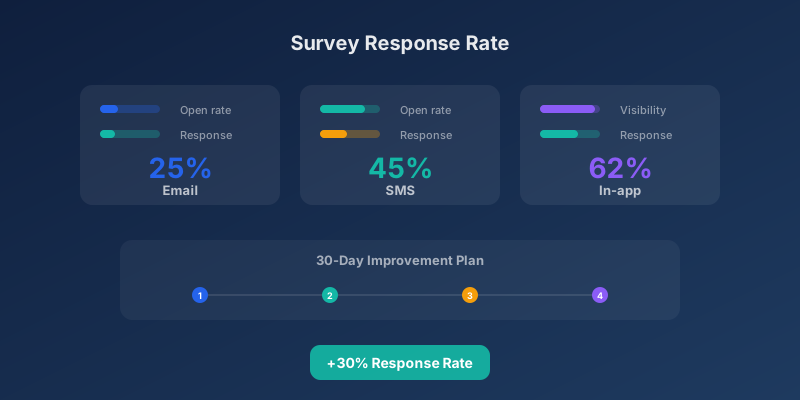
In B2B with few, large accounts, every response counts disproportionately. A response rate below 15-20% should make you question whether the number is representative. It is not the absolute count of responses that determines credibility, but whether the people who respond resemble the people who do not.
You raise the response rate with short surveys, relevant timing, a clear purpose, and visible follow-up on previous feedback. We have collected the concrete tactics in our guide on survey response rates.
How many responses is enough depends on how many accounts you have in total, not on a fixed threshold. With a small account base, the standard textbook formulas overstate your uncertainty: see B2B survey sampling with a small n for the actual math.
Measuring the buying group, not just your main contact
Most B2B satisfaction programmes survey one person per account: the primary contact, or whoever signed the renewal last year. That is a mistake, because a single contact's opinion is not the account's opinion.
Gartner's research on B2B buying puts the typical committee for a mid-market purchase at 6 to 10 stakeholders, and the number climbs into the double digits for larger enterprise deals. Those same people do not disappear once the deal is signed. They stay involved in renewal, expansion and internal advocacy, and each of them forms their own view of whether the relationship is working.
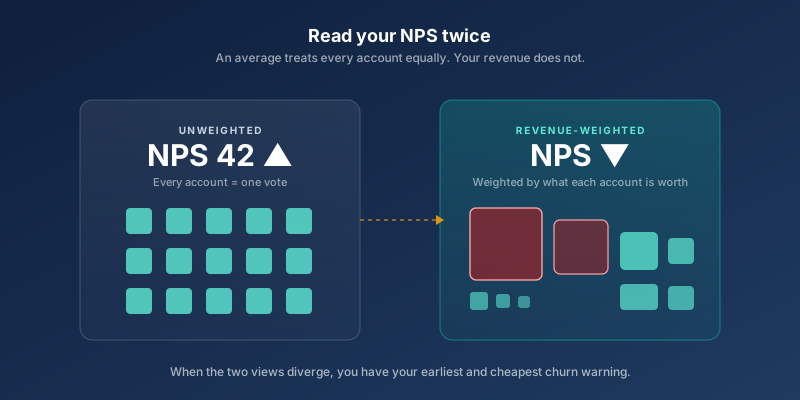
Here is the counterintuitive part: a happy champion can hide an account that is actually at risk. The person who championed the purchase has a personal stake in it succeeding, and will often rate you generously even when colleagues are quietly frustrated. If you only hear from that one voice, your NPS looks fine right up until the renewal conversation falls apart.
The fix is not complicated. Identify the two or three roles that matter for each account, typically the economic buyer, the day-to-day user, and an executive sponsor, and survey all of them on a light touch, staggered basis. Weight the responses by role and account value rather than averaging every voice equally. This is the core idea behind account-based CX: treat your feedback programme like your sales programme, and run it on the accounts and stakeholders that actually carry the revenue.
Cadence and timing
Timing is often the difference between usable and useless data.
- Relationship surveys: Quarterly or half-yearly. Frequent enough to catch the trend, rare enough to avoid fatigue.
- Transactional surveys: Within 24-48 hours of the event, while the experience is fresh.
- Coordination: Set a maximum frequency per customer, ideally one survey per quarter in total. Uncoordinated sends from multiple teams are one of the most common causes of declining response rates.
How to get started: a simple sequence
You do not need a mature program to start measuring meaningfully. In fact, it is better to start small and expand.
- Define the purpose. Which decision should the measurement support? Reduce churn, improve onboarding, increase expansion?
- Choose one primary metric. For most B2B companies, a quarterly relationship NPS is the right place to start.
- Define the audience. Who should respond? In B2B, often both decision-makers and day-to-day users.
- Keep the survey short. One scoring question plus one open follow-up is enough to begin with.
- Build the follow-up first. Decide before you send who follows up on dissatisfied responses, and how fast.
- Measure, learn, expand. Add transactional CSAT on your most important touchpoint once the relationship survey is running.
The common pitfalls
- Measuring without acting. The most expensive mistake of all. A survey creates an expectation that someone is listening. It is also the trap that keeps most programmes stuck at level 2 of the CX maturity model.
- Surveys that are too long. Every extra question costs responses. Only measure what you will act on.
- The wrong metric for the purpose. Using NPS to evaluate a single support case produces noise, not insight.
- Leading questions. "How amazing was your experience?" gives you the answers you want, not the answers you need.
- Comparing apples and oranges. A transactional CSAT cannot be compared directly with a relationship NPS.
- Ignoring the silent majority. Those who do not respond are often the ones you most need to hear from.
- Treating compliance as a settings page. Legal basis, data minimisation, and retention have to be decided before you send, not after. See our guide on GDPR and customer feedback in B2B.
Why continuous signals are joining the survey, not replacing it
Response rates are not just a B2B problem. Qualtrics' 2026 Consumer Experience Trends Report, based on a survey of 20,000 consumers across fourteen countries, found that only three in ten customers give direct feedback when asked. In B2B, where relationship surveys already struggle to clear 15-20%, that gap is even more consequential, because the accounts that do not answer are often the ones with the most at stake.
That has pushed more CX teams to treat the explicit survey as one input among several rather than the whole picture. Product usage data, support ticket volume and sentiment, and commercial signals like a slow-walked renewal conversation all say something about satisfaction before a customer ever opens a survey link. AI-driven text analytics on open feedback and a Customer Health Score that blends usage and support signals with survey data both work from the same premise: the survey alone arrives too late for some of your most at-risk accounts.
| Source | Example | Best for |
|---|---|---|
| Direct survey (NPS, CSAT, CES) | Quarterly relationship score, post-case rating | Benchmarking, and learning why through open text |
| Product and usage data | Login frequency, feature adoption, seat utilisation | Early warning before a survey would catch it |
| Support signals | Ticket volume, sentiment, escalations | Spotting friction between measurement cycles |
| Commercial signals | Renewal timing, expansion requests, stalled deals | Confirming or contradicting what the score says |
None of this makes the survey optional. Passive signals tell you which accounts to worry about, but they rarely tell you why, and they give you no external benchmark to compare against. A direct question, asked well and at the right moment, is still the fastest way to get a number you can act on and compare against your industry. The two approaches answer different questions, in the same way relationship and transactional measurement do, and the strongest Voice of Customer programmes treat surveys as one structured input into a bigger listening system rather than the system itself.
From measurement to action
The measurement itself is only half the work. Value appears when the number becomes a decision. But interpreting the number comes first, and a score means little in isolation: whether an NPS of 30 is strong or weak depends entirely on your industry, so read it against the NPS benchmarks by industry before you set a target.
A simple and effective approach is to close the loop: every time a customer gives a low score, someone responsible reaches out shortly after, understands the problem, and reports back on what is being done. It saves relationships in the short term and reveals patterns in the long term.
Beyond that, you should systematically analyse open-text responses to find recurring themes, quantify them, and prioritise the improvements that affect the most customers. In other words, measurement is not the goal. It is the instrument that tells you where to act first.
Frequently Asked Questions
Ready to know what your customers actually think?
SurveyGauge helps Nordic B2B companies move from gut feeling to data-driven CX decisions.
SurveyGauge Team
Customer Experience Experts
SurveyGauge-teamet hjælper virksomheder med at måle og forbedre kundetilfredshed via professionelle surveys, analyser og rådgivning.
You might also be interested in
View all articles![What Is Customer Satisfaction? The Complete B2B Guide [2026]](/img/knowledge/customer-satisfaction.svg)
What Is Customer Satisfaction? The Complete B2B Guide [2026]
Every company says they care about customer satisfaction. Yet few can define it, measure it properly, or connect it to revenue. Here is how to do all three.
NPS vs. CSAT vs. CES: Which Metric Should You Choose?
NPS, CSAT, and CES measure different things, and the real question in 2026 is not which one wins. It is when to layer a second metric on top of NPS, and when adding one just adds noise.
Account-Based CX: Run Your Feedback Programme on the Accounts That Pay the Bills
In most B2B companies a small share of accounts carries most of the revenue, yet every account gets the same survey and the same weight in the score. Account-based CX fixes that mismatch: weight feedback by account value, survey the whole buying group, and tier your follow-up.
![What Is NPS? The Complete Guide to Net Promoter Score [2026]](/img/knowledge/nps.svg)
What Is NPS? The Complete Guide to Net Promoter Score [2026]
NPS is the most widely used loyalty metric in the world, and also the most frequently misused. Indeed, the score means nothing without follow-up. Here is how to use it properly.
How to Improve Your Survey Response Rate: A Data-Driven Guide for B2B Teams
An NPS based on 12 responses out of 2,000 customers is not a measurement. It is noise. The industry's real average is 12.4%, not the 20-30% everyone quotes. Here is what actually gets a B2B programme into the forties, where the data starts to be trustworthy.