
Account-Based CX: Run Your Feedback Programme on the Accounts That Pay the Bills
In most B2B companies a small share of accounts carries most of the revenue, yet every account gets the same survey and the same weight in the score. Account-based CX fixes that mismatch: weight feedback by account value, survey the whole buying group, and tier your follow-up.
- Account-based CX means organising your feedback programme around accounts instead of individual respondents: aggregate feedback per account, weight it by account value, and cover the buying group rather than a single contact.
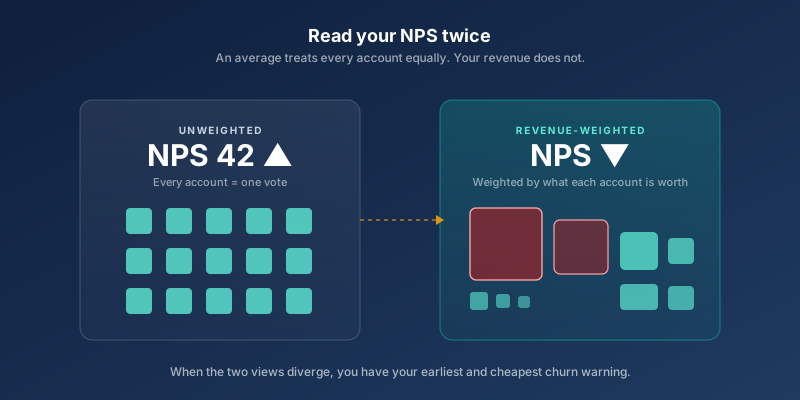
- An overall NPS gives a small account and your largest account one vote each. The score can rise while the accounts that fund your business quietly deteriorate. Check the revenue-weighted view before you celebrate.
- One respondent per account is a single point of failure. When that champion changes jobs, your relationship data walks out the door with them.
- By finance's own concentration-risk thresholds (commonly the top five accounts above 50 percent of revenue), most B2B portfolios are already over-concentrated. Account-based CX is how you monitor that risk on a monthly cadence instead of finding out at renewal, or in a data room.
- The contrarian part: most B2B programmes do not need to survey more customers. They need to survey fewer accounts more deeply, with real coverage of the people who decide the renewal.
Contents7 sections
In most B2B companies a small share of accounts carries most of the revenue, yet every account gets the same survey, the same cadence and the same weight in the score. Account-based CX fixes that mismatch.
What is account-based CX?
Account-based CX is the practice of running your customer experience programme at the account level: collecting feedback from multiple stakeholders per account, aggregating and weighting it by what the account is worth, and tiering your follow-up so your most valuable relationships get the fastest and deepest response. It borrows its logic from account-based marketing, and applies it to the other end of the customer lifecycle, where the revenue already lives.
The reason it matters is a structural mismatch that most B2B feedback programmes never address. Contracts, renewals, expansion and churn all happen at account level. Survey responses arrive at person level. If your programme stops at person level, you are measuring individuals and hoping the accounts take care of themselves. In B2C that is fine, because the person is the account. In B2B, where a single relationship can carry a meaningful share of your annual revenue, it is a blind spot with a price tag.
If your programme today consists of a quarterly survey to one contact per account and a company-wide score in a management deck, this article describes the upgrade path. For the fundamentals of programme design, our Voice of Customer guide covers the full system; this article zooms in on the account dimension.
Why does an average score hide your biggest risk?
Because an average is democratic and your revenue is not. In a standard NPS calculation, every response counts equally. A pilot customer paying a few thousand a year and a strategic account paying a few hundred thousand each get one vote. If your customer base looks like most B2B portfolios, a minority of accounts carries the majority of revenue, which means the score is dominated by the accounts that matter least to your P&L.
Take a hypothetical mid-market firm, Nordika A/S: 130 customers, where the top 15 accounts represent about 70 percent of revenue. Nordika's overall NPS is 42 and climbing, and the quarterly report looks great. Weight the same responses by contract value and the picture inverts: two of the five largest accounts have active detractors in the buying group, and one has gone quiet entirely. The unweighted score went up because twenty small, happy accounts responded. The revenue-weighted score is falling. Which number would you rather run the company on?
This is the single most useful habit in account-based CX: always read your score twice, once unweighted and once weighted by account value. It rests on a point that is easy to skip past, covered in what customer satisfaction is: satisfaction is multi-dimensional, so any single averaged number is hiding something. The two views agreeing is comfort. The two views diverging is the earliest, cheapest churn warning you will ever get. And the economics of acting on it are firmly on your side: Bain's research shows that a 5 percent increase in customer retention can lift profit by 25 percent or more (Bain & Company). If you need to turn that into a funded programme, the calculations in customer satisfaction and revenue are the ones finance will actually engage with. Nothing in your new-business pipeline compounds like keeping the accounts you already have.
The Boardroom Already Has a Name for This Concentration. Your NPS Dashboard Doesn't.
Revisit Nordika's numbers from the previous section: 15 accounts out of 130 carrying about 70 percent of revenue. That is not just a CX opportunity. By the standards corporate finance uses to price a company, it is a textbook customer concentration risk. Corporate Finance Institute's valuation framework flags a portfolio as high concentration once the top five customers pass 50 percent of revenue. SaaS M&A advisory L40 degrees sets the bar even lower: 30 to 40 percent of ARR sitting with the top three to five accounts is enough to trigger churn-sensitivity modelling in a due diligence process, and any single account above 10 percent gets flagged on its own.
Run those thresholds against Nordika, and finance's own playbook says the portfolio is over-concentrated by a wide margin. If Nordika were being acquired tomorrow, a buyer's diligence team would build a model of what happens to revenue and EBITDA if two of the five largest accounts walk, exactly the scenario the revenue-weighted score surfaced two paragraphs ago. The board's risk register and the CX programme are describing the same top-heavy portfolio. Only one of them tracks it by account, weighted by value, on a cadence tighter than once a year.
That is the reframe worth taking into your next leadership meeting. Account-based CX is not a CX-team nice-to-have running parallel to the business. It is the operational, always-on version of the concentration-risk monitoring your CFO already knows how to read, aimed one layer earlier: at relationship health, where you can still act, instead of at the contract renewal date, where you can only react. A detractor in a top-15 account is not a support ticket. It is the same risk factor a buyer would price into a deal, showing up months before it would hit a renewal forecast, let alone a data room. What you do with that warning is covered in reducing churn and, once an account has actually gone quiet or unhappy, in detractor recovery.
- Nordika A/S, top 15 accountsShare of revenue70%
- CFI high-concentration thresholdTop 5 accounts50%
- L40 degrees elevated-risk thresholdTop 3 to 5 accounts, share of ARR35%
Who should you survey inside an account?
More people than you do today. The default failure mode in B2B feedback is measuring an entire relationship through one person, usually the friendly day-to-day contact who answered the first survey three years ago. That person's score is real, but it is one seat in a buying group. The person who signs the renewal may see a completely different relationship, and the daily users may see a third one.
A workable minimum for strategic accounts is three active respondents across three roles: an economic buyer, a day-to-day owner of the relationship, and at least one hands-on user. The practical mechanics of getting there, which cadence to use and how to avoid burning the response rate by surveying everyone at once, are covered in how to measure customer satisfaction. Not because three is a magic number, but because those three roles fail in different ways and one of them alone will not warn you about the others. They also do not agree on what a good customer experience even is: the buyer judges outcomes, the daily user judges friction. That covers who you listen to on the customer side; who inside your own organization owns the account relationship and is accountable for acting on what those voices say is a separate question, and the subject of CX governance.
| Role | What their feedback tells you | Typical blind spot if it is your only source |
|---|---|---|
| Economic buyer (signs the renewal) | Perceived value versus price, strategic fit, appetite to expand | Knows little about daily friction; positive until suddenly not |
| Relationship owner (your champion) | Process quality, collaboration, how easy you are to work with | Personal goodwill masks account risk; leaves, and the data leaves too |
| Daily users | Product and delivery reality, effort, recurring irritations | Cannot see commercial context; individually noisy, collectively early |
Track coverage as a programme metric: what share of your A-tier accounts has at least three active respondents in defined roles? In our experience that number is embarrassingly low the first time a company measures it, and raising it does more for the reliability of your account picture than any tweak to the survey itself. A relationship measured through one champion is not a measured relationship. It is an anecdote with a dashboard.
- One account
- Economic buyerPerceived value versus price, appetite to expand
- Relationship ownerProcess quality and how easy you are to work with
- Daily usersProduct reality, effort, recurring irritations
How do you tier accounts, and what actually changes per tier?
Tiering is where account-based CX stops being a reporting exercise and starts changing behaviour. Split the portfolio simply: A-tier for the strategic accounts that would hurt to lose, B-tier for the solid middle, C-tier for the long tail. The tiers then drive three concrete differences.
Cadence and depth. A-tier accounts get a relational NPS rhythm plus structured conversations, typically tied to quarterly business reviews. B-tier gets the standard relational cadence. C-tier gets lighter-touch measurement, largely automated. You are deliberately spending your survey budget, and your customers' attention, where the revenue is.
Follow-up speed. A detractor response from a C-tier account goes into the normal follow-up queue. The same score from an A-tier account is an incident: named owner, contact within 24 to 48 hours, escalation path to management. The speed is not cosmetic. CustomerGauge's benchmark research finds that closing the feedback loop within 48 hours lifts retention by 12 percent and NPS by an average of 6 points. On the accounts that fund your business, that window should be policy, not aspiration. Our close the loop guide covers the operating model, and how to deliver great customer service covers what tiered treatment looks like at the support desk, including which kinds of customer effort are worth removing and which are not.
Who sees the feedback. C-tier feedback aggregates into themes for product and service improvement. A-tier feedback lands, verbatim, with the account team and their manager, and feeds the account plan directly. That named team is also a dependency worth measuring: employee loyalty sets a ceiling on the experience an account can have, and in a tiered programme the A-tier team carries the most of it. If an A-tier customer took the time to write three angry sentences, someone who knows the account should read all three, the same day. AI text analytics is what makes that same-day promise workable at volume: automatic tagging by theme, sentiment and urgency decides which comments demand a human read first. Reading it is also what makes the follow-up feel personal rather than templated, and that is the mechanism behind personalization as the strongest driver of loyalty: at account level, personalizing means referencing what this account actually told you, not merging a first name into a subject line.
Tiering also gives you the one response-rate number worth watching. A blended figure across the whole portfolio tells you almost nothing, because it averages a long tail that answers freely with a small set of accounts whose silence costs you most. Break the rate down by tier and the uncomfortable pattern usually shows up immediately: A-tier accounts, the ones with the busiest contacts and the most at stake, often respond least. How to improve your survey response rate covers what to do about that, and why the honest industry average is a good deal lower than the benchmark reports suggest.
How do you turn account feedback into account plans?
The output of account-based CX is not a score per account. It is a decision per account. Three mechanisms make that happen.
First, give every key account a single feedback picture. Responses across roles, over time, in one view, next to usage and commercial data. This is the same logic as a customer health score, and survey feedback should be one of its strongest inputs: a falling score from the economic buyer is a leading indicator that no usage metric will show you.
Second, put feedback on the QBR agenda. Not as a slide with a number, but as the opening question: here is what your team told us this quarter, here is what we changed because of it. Customers who see their feedback produce action respond again next time, and tell you things they would never put in a survey box. That loop is also one of the most reliable ways to build durable loyalty in a portfolio of key accounts.
Third, roll account learnings up to portfolio level. When the same theme appears across several A-tier accounts, you have found a strategic priority, not an account issue. If your portfolio spans several business units or countries, weight that roll-up by account value rather than response count, or the largest unit sets the whole picture; see Voice of Customer across business units. Key driver analysis tells you which of those themes actually move loyalty and which are just loud, so the roadmap conversation is about evidence instead of the most recent angry email.
Where does SurveyGauge fit in?
SurveyGauge is built for exactly this shape of programme: B2B portfolios where accounts, not respondents, are the unit that matters. The platform aggregates feedback per account across multiple stakeholders, and our advisory team helps you design the tiering, the buying-group coverage and the QBR integration, because the software alone does not change how your organisation treats its key accounts. That combination, platform plus advisory in one subscription, is the difference between owning a dashboard and running an account-based CX programme.
Your most valuable accounts deserve better than an average. SurveyGauge combines an account-based feedback platform with hands-on CX advisory in one subscription. Get a free demo or see pricing.
Frequently Asked Questions
Ready to know what your customers actually think?
SurveyGauge helps Nordic B2B companies move from gut feeling to data-driven CX decisions.
SurveyGauge Team
Customer Experience Experts
SurveyGauge-teamet hjælper virksomheder med at måle og forbedre kundetilfredshed via professionelle surveys, analyser og rådgivning.
You might also be interested in
View all articles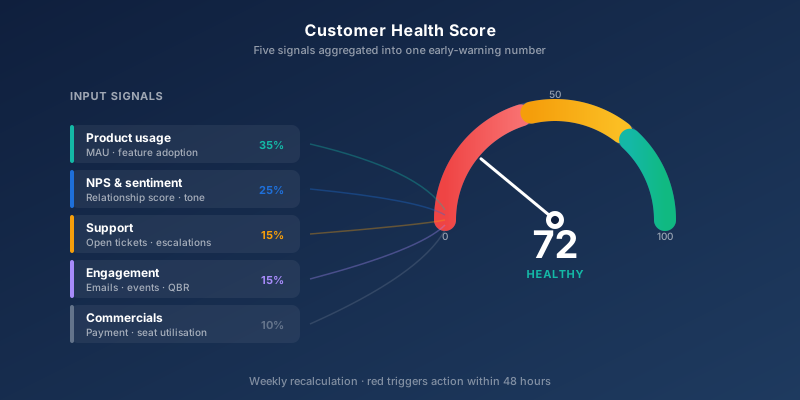
Customer Health Score: Build an Early Warning System for Churn
Customers decide to churn 60-90 days before the cancellation hits your CRM. A Customer Health Score surfaces the signal before you lose them. Here is how to build one that actually works.
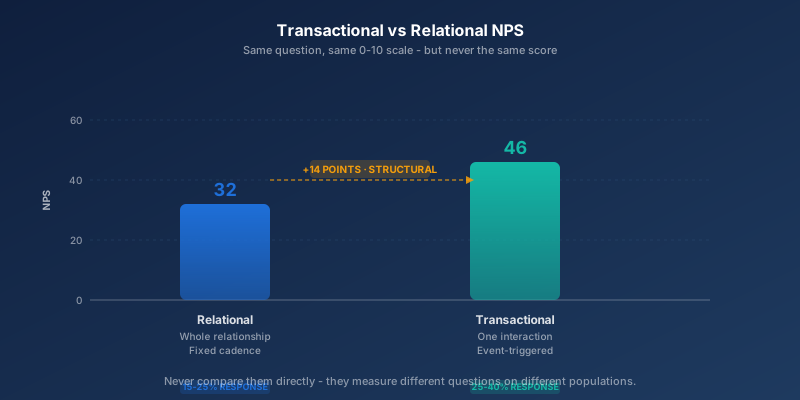
Transactional vs. Relational NPS: When to Use Each in B2B
Relational NPS tells you if the relationship is healthy. Transactional NPS tells you where a process broke. Most B2B companies measure one, too rarely, and then compare two numbers that were never comparable.
![Close the Loop: The Complete Guide to NPS Follow-Up [2026]](/img/knowledge/close-the-loop.svg)
Close the Loop: The Complete Guide to NPS Follow-Up [2026]
Most B2B companies that measure NPS never act on it. This guide breaks down the 48-hour rule for Detractors, segment-specific workflows for Detractors, Passives and Promoters, the CRM integration that makes it stick, and the four numbers that prove it is working.