
How to Reduce Churn: 7 Strategies That Work
Churn is the most expensive problem most B2B companies underestimate. Seven strategies that work, from NPS early warning systems to win-back campaigns, with the CustomerGauge and Bain research behind each one.

- Acquiring a new customer costs 5-7x more than retaining an existing one, and most companies still underestimate the true cost of a churned account, because lost subscription revenue is only 20-30% of it.
- Customers decide to leave 60-90 days before they cancel. The signals are visible, declining usage, low NPS, repeated support tickets, if you know where to look.
- First-90-days churn is the most preventable kind. Proactive onboarding CSAT tracking cuts it by 30-40%.
- Revenue is rarely spread evenly: by the Pareto rule of thumb CustomerGauge applies to B2B, around 80% of revenue likely sits with about 20% of accounts, yet most churn programmes still treat a $500-a-month Detractor and a $50,000-a-month Detractor the same way.
Contents13 sections
What Does Churn Actually Cost a B2B Company?
Churn is the share of customers who stop buying from you in a given period, and most companies underestimate what it actually costs because they only look at the lost subscription revenue for that period. That is 20-30% of the real number.
The full cost of a churned account:
- Lost Customer Lifetime Value. Not one quarter of revenue. All remaining future revenue from that account.
- Replacement cost. Acquiring a new customer to fill the gap costs 5-7x more than retaining the one you lost (Bain & Company).
- Hidden damage. Churning customers talk to their peers. In a B2B market where buying decisions run through reference calls and tight industry networks, one vocal ex-customer can quietly poison several deals already in the pipeline.
To get leadership's attention, calculate one number: churning customers per year multiplied by average CLV. For most B2B companies, that figure alone is large enough to secure budget immediately, which is exactly why every strategy below exists.
What Is a Normal Churn Rate for a B2B Company?
There is no single answer, and any article that gives you one number is oversimplifying. CustomerGauge's 2026 State of B2B Account Experience report, based on primary research across 11 B2B industries, puts average retention at 72.5%, which is a 27.5% annual churn rate. The spread around that average is the real story.
| Industry | Median retention | Median churn |
|---|---|---|
| Energy / Utilities | 89% | 11% |
| IT Services | 88% | 12% |
| Computer Software (B2B) | 86% | 14% |
| B2B Industry Services | 83% | 17% |
| Financial Services | 81% | 19% |
| Professional Services | 73% | 27% |
| Telecommunications | 69% | 31% |
| Manufacturing | 65% | 35% |
| Consumer Packaged Goods | 60% | 40% |
| Logistics | 60% | 40% |
| Wholesale | 44% | 56% |
Source: CustomerGauge, State of B2B Account Experience report (2026).
A 27% churn rate in manufacturing is not a failure. A 27% churn rate in IT services, where the median is 12%, is a five-alarm fire. Read your own number against your industry's median before deciding whether you have a churn problem or a normal one. Once you have that number, compare it against your NPS benchmark too, not just the industry churn figure, since the two together tell you whether you have a satisfaction problem or a value problem.
Here is the uncomfortable part. According to CustomerGauge, 44% of B2B companies do not know their retention rate at all, and 62% do not measure the ROI of their CX programme. Most of the seven strategies below assume you already know your number. If you do not, strategy zero is this: calculate it this quarter, before you touch anything else. A churn-reduction programme built on a number nobody tracked is not a programme. It is a hope.
- Energy / Utilities11%
- IT Services12%
- Computer Software (B2B)14%
- B2B Industry Services17%
- Financial Services19%
- Professional Services27%
- Telecommunications31%
- Manufacturing35%
- Consumer Packaged Goods40%
- Logistics40%
- Wholesale56%
When Do Customers Actually Decide to Leave?
Customers do not churn the day they cancel. The real decision window is 60-90 days before cancellation. By then, they have already evaluated alternatives, discussed it internally, and emotionally disengaged.
The signals are visible if you look for them:
- Declining product usage or login frequency
- Low NPS score (Detractor, 0-6)
- Repeated support tickets about the same unresolved issue
- Skipping QBR meetings or not responding to account manager outreach
- Silence where there used to be engagement
- Pricing questions or requests for contract flexibility
Strategy 1: Use NPS as an Early Warning System
The most effective churn prevention tool is identifying dissatisfied customers before they decide to leave. NPS does this directly: willingness to recommend is a strong proxy for future behaviour.
How to implement:
- Quarterly relational NPS to the full customer base
- Automatic Detractor flagging (score 0-6) in CRM
- Account manager contacts every Detractor within 48 hours
- Track churn rate by NPS segment over 12 months
Detractors churn at 4-6x the rate of Promoters. A 10-point reduction in Detractor share has significant bottom-line impact. For the complete NPS follow-up playbook: Close the Loop. For the deeper playbook on saving the accounts this system flags, see Detractor Recovery.
Churn Is Rarely a Surprise. It Is a Maturity Gap.
When a named account leaves, the account manager is almost never actually surprised, not in hindsight. They saw the signs: slower replies, a quieter champion, a competitor mentioned in passing. What they lacked was a system for turning that gut feeling into action before the renewal conversation. Key driver analysis turns scattered comments into a ranked list of what is actually driving the risk, and the CX maturity model shows whether your organisation has the process to act on that list before the account is already gone. If your largest accounts get the same generic follow-up as your smallest, account-based CX is the fix.
Strategy 2: Fix Onboarding With CSAT Checkpoints
First-90-days churn is the most preventable form of churn. Customers who do not see early value quietly disengage and leave at the first renewal opportunity.
How to implement:
- CSAT at day 7: has the customer started successfully?
- CSAT at day 30: have they achieved their first meaningful outcome?
- CSAT at day 90: are they fully adopted and seeing ongoing value?
- Proactive outreach to every customer who scores low at any checkpoint
Companies that track and act on onboarding CSAT see a 30-40% reduction in first-90-days churn. The mechanism is simple: you reach the struggling customer before they give up. For a more diagnostic version of this checkpoint, see our guide to designing a B2B onboarding survey that measures effort and first value instead of completion, so it catches friction the CSAT number alone would miss.
Strategy 3: Close the Loop on Negative Feedback
Close the loop is the process of following up on every piece of negative feedback with a personal conversation and a real resolution. The Customer Experience Board found that customers who complained and received a professional resolution are more loyal than those who never had a problem.
How to implement:
- Automatic CRM notification on negative NPS or low CSAT
- 48-hour rule: every Detractor contacted within 2 business days
- Root cause documented in CRM
- Resolution tracked: was the problem actually fixed?
- Re-survey 30-60 days later to confirm improvement
Systematic close-the-loop programmes save 20-30% of customers who would otherwise churn. CustomerGauge's research shows that companies closing the loop on all feedback within 48 hours see up to a 12% lift in retention and an average 6-point lift in NPS (CustomerGauge, 2026). Compare that against your own benchmark before assuming your follow-up process is fast enough. For the detailed framework: Close the Loop: The Complete Playbook.
Strategy 4: Build a Customer Health Score
Individual metrics tell you part of the story. A composite Health Score tells you the whole thing.
- Product usage (30-40% weight): login frequency, feature adoption, activity trends
- Support signal (20-25% weight): open tickets, resolution time, CSAT scores
- Payment behaviour (15-20% weight): on-time payments, billing disputes
- Engagement (10-15% weight): email opens, event participation, communication responsiveness
- Sentiment (15-20% weight): NPS score, survey participation, open-ended comment tone
A customer with declining usage, an open support ticket, and a recent NPS of 4 is at severe risk. No single signal would trigger an alert on its own, which is exactly the point of combining them.
How to implement: define a scoring model, integrate data from product analytics, CRM, and support into a dashboard, and create automatic alerts when a customer crosses below a threshold. Proactive Customer Success outreach on health-score declines stops churn before the customer has decided to leave. For the full build, see our Customer Health Score guide.
- Product usage30-40% weight35%
- Support signal20-25% weight22.5%
- Payment behaviour15-20% weight17.5%
- Sentiment15-20% weight17.5%
- Engagement10-15% weight12.5%
Strategy 5: Understand Why Customers Actually Leave
Knowing the churn rate is not enough. Knowing why customers leave is what tells you where to invest.
Exit survey (send to every churning customer):
- What was the primary reason for leaving?
- What would have made you stay?
- What will you use instead?
Exit interviews (for top-tier accounts): a 15-minute phone conversation with a departing enterprise customer reveals more than a hundred survey responses. Have someone senior make the call, not the account manager who owns the relationship.
Churn reasons vary by industry:
| Reason | SaaS | E-commerce | Finance |
|---|---|---|---|
| Price/value | 30-40% | 25-35% | 20-30% |
| Missing features | 20-30% | 15-20% | 10-20% |
| Better alternative | 15-25% | 20-30% | 15-25% |
| Poor experience | 10-20% | 15-25% | 15-20% |
| Own circumstances | 10-15% | 10-15% | 15-20% |
Analyse the patterns. If price/value is the top reason, the fix is not discounting, it is demonstrating value better. If "poor experience" is concentrated in onboarding, the fix is obvious.
Strategy 6: Prioritise by Customer Value
Not every account justifies the same retention investment. Segment by CLV and allocate resources accordingly.
CustomerGauge's 2026 B2B benchmark guide puts the concentration risk bluntly. It points to the Pareto principle, under which around 80% of your revenue is likely to come from about 20% of your customers, and frames the danger with a hypothetical: a company with $100 million in revenue whose NPS survey finds $75 million of it sitting with Detractor accounts "might be in trouble" (CustomerGauge, "B2B NPS Benchmarks by Industry: 2026 Data and Revenue Guide", 28 August 2026). That is a concentrated, flashing warning light, not a rounding error. If you cannot currently say what share of your revenue sits with your Detractors, that is the real strategy zero here, before you build the tiering below.
- High-value Detractors: senior account manager calls personally. Escalation to leadership if needed.
- Mid-value Detractors: account manager email with a specific offer of a conversation.
- Low-value Detractors: automated email with self-service resources and a path to escalate.
In SaaS, enterprise accounts are typically 10-50x more valuable than SMB accounts. Treating your largest account's complaint the same as your smallest account's complaint is not fairness. It is a resource-allocation mistake dressed up as equal treatment, and it is honest about where retention investment generates the highest return.
- Top 20% of accountsLikely share of revenue80%
- Other 80% of accountsLikely share of revenue20%
Strategy 7: Run Win-Back Campaigns That Address the Real Reason
A customer who left is not necessarily gone forever. Win-back campaigns that address the actual churn reason achieve a 20-40% success rate when contact happens within 30 days.
What works:
- Know exactly why they left (from exit survey or conversation)
- Address the specific reason: "We have shipped the integration improvement you mentioned"
- Contact within 30 days. After that, the success rate drops sharply.
- Personal outreach from a senior person outperforms automated emails by a wide margin
What does not work: a 20% discount to someone who left because your product lacked a critical feature. Win-back must address the reason, not bribe the customer back into a situation that will produce the same outcome.
What Is a Percentage Point of Churn Actually Worth?
Bain & Company's often-cited research found that a 5-percentage-point improvement in retention increases profit by 25% to 95%, depending on the industry. The range is wide because the mechanism compounds: a retained account keeps its full lifetime value, refers other accounts, and costs nothing to re-acquire.
Take a fictional example. Nordika A/S runs a portfolio of 220 named B2B accounts worth an average of DKK 340,000 in annual revenue, with a gross margin of 60%. At a 27% churn rate (the professional-services median above), Nordika loses roughly 59 accounts a year, worth just over DKK 20 million in revenue. Cutting churn by 5 percentage points, from 27% to 22%, keeps 11 more accounts and roughly DKK 3.7 million in revenue that would otherwise have to be replaced through new sales, at a fraction of the acquisition cost. That churn, though, is not evenly spread: following the 80/20 pattern from Strategy 6 above, a disproportionate share of that DKK 20 million risk almost certainly sits concentrated in a small number of named accounts, which is exactly why the tiering matters as much as the aggregate number does. That is the business case your CFO wants to see, not the churn percentage itself. For the full model connecting satisfaction data to revenue, see Customer Satisfaction and Revenue.
None of this works without an early-warning system that tells you which of the 220 accounts are the 59 before they leave. That is what a customer health score is for.
- Churn rate-5%Today27%After22%
What We Actually See in Practice
Among the B2B companies we work with, churn reduction always starts with the same two realisations.
The churn rate hides everything. A company-wide 7% annual churn looks manageable. Break it down and you find enterprise at 3% and mid-market at 18%. The aggregate masks a crisis in one segment.
Retention is a system, not a campaign. Companies that reduce churn sustainably do not run one-off retention projects. They build early warning systems (NPS plus health score), fix onboarding systematically (CSAT checkpoints), close the loop on every Detractor, and continuously invest in understanding why customers leave.
Measuring Churn Reduction
Track monthly:
| Metric | What it tells you |
|---|---|
| Monthly churn rate | Headline metric. Segment by tier and product. |
| Revenue churn rate | The financial impact of churn. More important than logo churn for B2B. |
| NPS Detractor rate | Leading indicator. Rising Detractor share predicts rising churn. |
| Close-the-loop rate | % of Detractors contacted within 48h. Operational discipline. |
| Recovery rate | % of contacted Detractors who do not churn. Programme effectiveness. |
| Win-back rate | % of churned customers who return. Last-resort effectiveness. |
Segment everything by cohort, customer tier, and product. An overall rate of 5% can hide a 2% rate in your best segment and a 15% rate in your worst.
For the business case behind churn reduction, see Customer Satisfaction and Revenue. And if the tooling is in place but nobody has the time to operate the work around it, read about Retention as a Service, the delivery model where the vendor shares accountability for exactly the numbers this article is about.
Frequently Asked Questions
Ready to know what your customers actually think?
SurveyGauge helps Nordic B2B companies move from gut feeling to data-driven CX decisions.
SurveyGauge Team
Customer Experience Experts
SurveyGauge-teamet hjælper virksomheder med at måle og forbedre kundetilfredshed via professionelle surveys, analyser og rådgivning.
You might also be interested in
View all articles![Close the Loop: The Complete Guide to NPS Follow-Up [2026]](/img/knowledge/close-the-loop.svg)
Close the Loop: The Complete Guide to NPS Follow-Up [2026]
Most B2B companies that measure NPS never act on it. This guide breaks down the 48-hour rule for Detractors, segment-specific workflows for Detractors, Passives and Promoters, the CRM integration that makes it stick, and the four numbers that prove it is working.
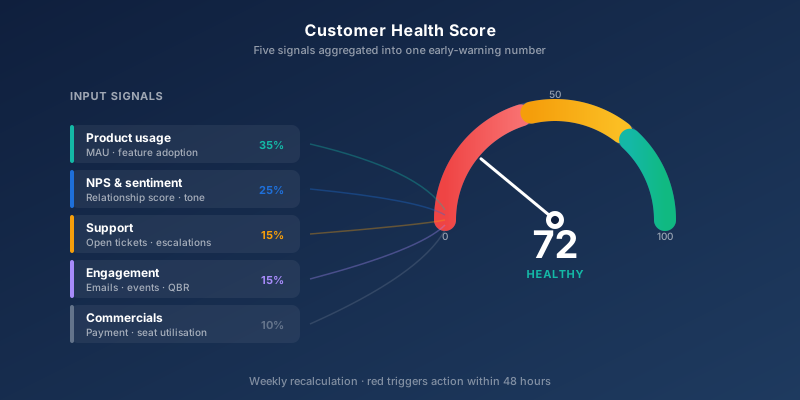
Customer Health Score: Build an Early Warning System for Churn
Customers decide to churn 60-90 days before the cancellation hits your CRM. A Customer Health Score surfaces the signal before you lose them. Here is how to build one that actually works.
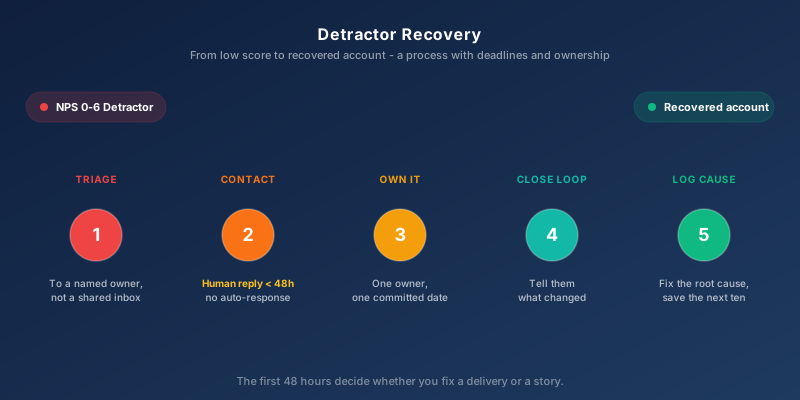
Detractor Recovery: The Playbook for Saving Unhappy B2B Accounts
A detractor is not a lost account. It is the most recoverable revenue you have, but only if you treat recovery as a process with deadlines and owners, not a goodwill gesture. Here is the playbook.