TL;DR
- The 384-response rule assumes a huge population. With 40 to 100 accounts, 25 to 50 responses can be enough to read a score, because finite population correction shrinks the margin when you hear from a large share of your base.
- With 25 responses from 40 accounts, an NPS carries roughly ±16 points at 90% confidence. With 15 responses it is roughly ±25. Below 30 responses, read the score as direction, not as a number.
- That margin only covers random sampling noise. It says nothing about the accounts that stayed silent, and in B2B the silent ones often hold the revenue.
- Counterintuitive: 25 responses that cover your ten biggest accounts are worth more than 60 that miss them. Report coverage by accounts, revenue and roles before you report the score.

Contents8 sections
How many responses does a B2B survey need?
It depends on how many accounts you have, not on a rule of thumb. If your base is 40 to 100 named accounts, 25 to 50 responses are often enough to read a score with a margin you can live with, and the famous 384 is the wrong target. With 25 responses from 40 accounts, an NPS carries a margin of error of roughly ±16 points at 90% confidence. With 15 responses it is roughly ±25. That is wide, but it is honest, and it is a very different message from "you need 384".
The number is only half the answer. A margin of error describes one thing: the noise you get from hearing from a subset of accounts drawn at random. It does not describe who chose to answer. In a B2B base where a handful of accounts carry most of the revenue, that second question decides whether the score means anything. This article covers both: how to size the survey, and how to check that the people who answered are the ones you needed to hear from.
Why the 384 rule fails with 40 accounts
The 384 figure is what you get when you ask for ±5 percentage points at 95% confidence and assume a very large population (n = z² × p × (1 - p) / e², with p at 50%). It is the right answer for a consumer panel of millions. It is the wrong answer for 40 accounts, where 384 is nearly ten times your entire base. Take it at face value and you conclude that small-base surveys cannot be measured at all. They can. You need a formula built for a finite population.
The same logic applies to a relational NPS and even more to transactional surveys, where the number of events per period is small and each response is a large share of the whole.
Finite population correction: what it changes
When you survey a large share of a small population, every response removes uncertainty that the textbook formula leaves in. Finite population correction (FPC) accounts for that: n = n0 / (1 + (n0 - 1) / N), where n0 is the uncorrected sample size and N is the number of accounts. The gain is largest when you are already close to the whole base.
| Target margin of error (95% confidence) | Large population | 100 accounts | 40 accounts |
|---|---|---|---|
| ±20 percentage points | 24 | 20 | 16 |
| ±15 percentage points | 43 | 31 | 21 |
| ±10 percentage points | 96 | 50 | 29 |
| ±5 percentage points | 384 | 80 | 37 |
Responses needed to estimate a share (a proportion, worst case p = 50%). SurveyGauge's own calculation with the standard formula above: the uncorrected size is rounded to the nearest whole response, as in the familiar 384, and the corrected sizes are rounded up. NPS is a difference of two shares and needs somewhat more, see the NPS table below.
One caveat before you lean on this. FPC assumes the responders are a random draw from your accounts. If the accounts that answer are the ones that like you, or the ones whose champion has time, the corrected margin is narrower than the real uncertainty. That is the subject of the next section.
What a margin of error does not cover
Three things sit outside the formula, and in B2B each of them is usually larger than the sampling noise.
Who did not answer. Silent accounts differ from vocal ones. CustomerGauge reports an average NPS response rate of 12.4% across B2B companies, with a range from 4.5% to 39.3% (blog post by Ian Luck, 2 April 2026, based on its own report "The State of B2B Account Experience", sample and method not stated). Its 2026 Decade Edition says that 40% of companies in the survey have a contact response rate of 10% or less (blog post, 9 October 2026). If 10% answer, 90% of what you want to know is unobserved, and no formula bridges that.
Who answers every time. The same Decade Edition post reports that about 40% of respondents are repeat responders who generate 60 to 70% of all responses. A small, friendly group can speak for the whole base without anyone noticing.
How much each account weighs. A margin of error counts every account once. Your revenue does not. One account of forty may carry 8% of turnover, and a silent top-ten account is a bigger hole than a silent account in the tail. The Decade Edition says 60% of programmes do not know what share of revenue their feedback reaches.
Read these figures with care: CustomerGauge sells NPS software, the numbers are self-reported by its sample and its customers, and the two reports use different bases. They are indications of the pattern, not measurements of your base. For tactics that lift response, see how to improve your survey response rate and survey design best practices.
Coverage beats count: a hypothetical example
Take Nordika A/S, a fictional B2B supplier with 40 customer accounts. The ten biggest account for 55% of revenue, the other thirty for 45%. A survey gets 25 responses, a response rate of 63%, which most programmes would be happy with. The same trap appears in commercial banking, where the person who answers the lender's survey is rarely the one who deals with it every day, as shown in CX in financial services.
Here is who answered: four of the ten biggest accounts and 21 of the thirty others. The six silent top accounts hold about 33% of revenue. The 25 responders cover just over half of revenue. Suppose the NPS among responders is +32. With FPC the margin is roughly ±16 at 90% confidence, so the interval runs from about +16 to +48, and Nordika can report that with a straight face.
It would still be the wrong number to steer by. No formula tells you what those six accounts would have said, and they are the ones whose departure would show up in next year's accounts. Now compare a second survey with 15 responses, all ten of the biggest accounts among them. Its margin is wider, about ±25 points, but it covers the accounts that matter. Which one is better is not a statistical question.
This is the counterintuitive part: when your base is small, the margin of error is the smallest of your measurement problems. Before you report a score, report three coverage numbers next to it:
- Accounts: the share of accounts with at least one response (63% in the example).
- Revenue: the share of revenue those accounts represent (just over half).
- Roles: the share of key accounts where you heard from more than one role, not only the champion. Account-based CX is built on this view.
- Accounts with a response63%
- Revenue covered (approx.)54%
- Top-ten accounts with a response40%
Reading NPS with fewer than 30 responses
NPS is a difference of two shares, so its margin is wider than the margin of a single percentage. MeasuringU (Lewis and Sauro, 5 January 2021) recommends the adjusted-Wald method for NPS confidence intervals, and its worked examples with 36 and 31 responses give margins of about ±20 and ±22 points at 90% confidence. Using their maximum realistic variance estimate of 0.67 (Lewis and Sauro, 20 July 2021), the table below shows what to expect.
| Responses (n) | Large population | 40 accounts (with FPC) |
|---|---|---|
| 10 | ±37 | ±33 |
| 15 | ±32 | ±25 |
| 20 | ±28 | ±20 |
| 25 | ±25 | ±16 |
| 30 | ±23 | ±12 |
| 48 | ±19 | not applicable |
| 88 | ±14 | not applicable |
Margin of error in NPS points at 90% confidence. SurveyGauge's own calculation: z × √(0.67 / (n + 3)), with z = 1.645, multiplied by √((N - n) / (N - 1)) for a population of N = 40. This is not a table published by MeasuringU. Variance 0.67 is deliberately conservative.
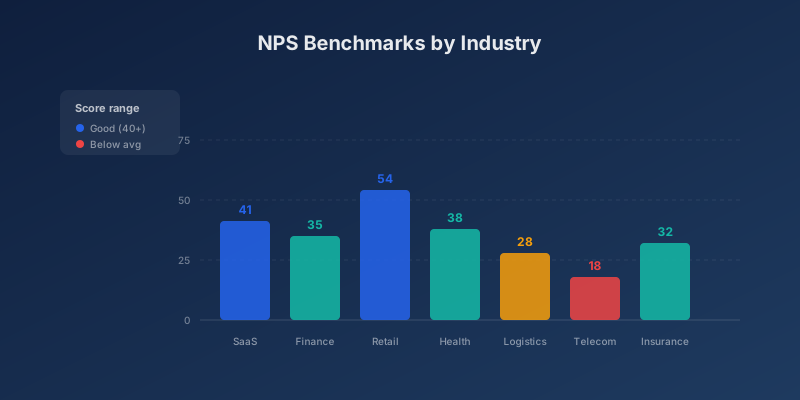
Three rules follow. First, under about 30 responses, read the score as a direction. Look for a consistent move over several survey cycles, and for agreement with other signals such as CSAT, support volume or usage, before you act. Second, do not split a small sample into segments. A segment of eight responses has a margin of more than ±35 points and will mostly show you noise. Third, be careful when you compare a small-n score with an industry figure, for instance from NPS benchmarks by industry: with a margin of ±20, a score 10 points above or below the benchmark tells you nothing.
The same applies to ranking what drives the score. A key driver analysis fits a regression, and with few responses the ranking of drivers is unstable. Use it to form hypotheses, not to settle them.
- Large population
- 40 accounts, with FPC
- n = 103733
- n = 153225
- n = 202820
- n = 252516
- n = 302312
What to do when you can reach most of your accounts
When you can realistically hear from most of your base, you are running a census, and the question changes. FPC shrinks the margin steadily the closer you get: with 36 responses from 40 accounts the margin is about ±7 points. But the more useful move is to stop computing intervals and start listing names. Which accounts have not answered? Who owns the relationship? Can someone call them this week?
That is where the survey turns into action. Silence is a data point about account health. A detractor who answers gives you a recovery case, and a silent top account gives you one too, just without the label. Responses that are followed up, as described in close the loop for NPS, give people a reason to answer next time. Collect the rest in a Voice of Customer programme where the same account view runs through surveys, support and conversations, and if several business units report one group score, weight it by the same coverage logic, as set out in Voice of Customer across business units. For satisfaction measurement in general, see how to measure customer satisfaction.
Where SurveyGauge fits
SurveyGauge shows the response rate per account next to the score, so you can see at once which key accounts are silent and who owns them. Reporting can weight by account and by role instead of counting every response the same. The advisory side helps you decide the minimum coverage that makes a score reportable to your board. We are partners in the programme, not a tool that hands you a number.
Frequently asked questions
How many responses do you need for a reliable B2B NPS?
It depends on the number of accounts. With 25 responses from 40 accounts, an NPS has a margin of roughly ±16 points at 90% confidence, and with 15 responses roughly ±25. A large consumer population needs 96 responses for ±10 percentage points on a share, but a base of 40 accounts needs only 29. Reliability also depends on who answered, so check coverage of your biggest accounts first.
What is finite population correction and why does it matter with 40 accounts?
Finite population correction reduces the required sample size when you survey a large share of a small population, because every response removes uncertainty. For ±10 percentage points at 95% confidence, a large population needs 96 responses, 100 accounts need 50 and 40 accounts need 29. It assumes the responders are a random draw, which is rarely true in B2B.
Can you trust an NPS based on 15 to 20 responses?
Only as a direction. At 15 to 20 responses from 40 accounts the margin is roughly ±20 to ±25 points at 90% confidence, and wider in a larger base. Look for a consistent move across several survey cycles, agreement with other signals, and coverage of your largest accounts before you act on it.
What is the difference between margin of error and statistical significance?
The margin of error describes how far the true score could be from the one you measured, given random sampling. Statistical significance asks whether a difference between two scores is larger than that noise. With a margin of ±20 points, a change from +30 to +40 between two surveys is well within noise, and neither measure covers bias from accounts that did not answer.
Should you segment a small B2B sample?
Usually not. Every segment has fewer responses, so the margin grows quickly: a segment of eight responses has a margin of more than ±35 points. Segment by account tier or role only when the segments are large enough, or treat the segment as a list of named accounts to follow up rather than as a statistic.
Does response rate matter more than sample size?
In a small base, yes, because the response rate tells you how much of the base you have not heard from. CustomerGauge reports an average B2B NPS response rate of 12.4% with a range of 4.5% to 39.3%, and 40% of companies in its Decade Edition at 10% or lower. A good response rate from the wrong accounts is still a weak result, so report coverage by accounts, revenue and roles.
When is a B2B customer base effectively a census?
When you can hear from most of your accounts and know the names of the rest. There is no fixed threshold, but with 36 responses from 40 accounts the margin falls to about ±7 points. At that point stop computing intervals, list the silent accounts, and assign someone to contact each of them.

Written by
SurveyGauge Team
The advisors and developers behind SurveyGauge. We run customer satisfaction programmes for B2B companies, from 20 key accounts to global banks.